
by Dr. Elizabeth Dressler, ASA Lead Geneticist
Economic selection indexes are a valuable tool for selection and mating decisions. One major benefit is that selection indexes combine several traits into one number that estimates expected progeny profitability for a specific production system.
When you open a sale catalog to compare two bulls, economic indexes are designed to help answer a practical question: “Which bull is expected to sire the more profitable set of calves within this production system?” ASA publishes two economic selection indexes: the all-purpose index ($API) and the terminal index ($TI). These indexes help Simmental breeders make more informed decisions by bringing the economic importance of several traits together in one easy-to-use tool.
Why is ASA updating $API and $TI? $API and $TI are valuable tools for Simmental breeders and have helped make meaningful genetic progress in the breed. If you are a Simmental breeder who has used $API or $TI over the years, you have likely seen the value of these selection tools in your own herd. In other words, the previous indexes were not wrong. Simmental breeders have made progress using them, and they have served the breed well. ASA is making key updates so the indexes will be even better selection tools. The beef industry has changed in recent years, and our technology and ability to analyze data have also advanced significantly. Together, these changes give ASA an opportunity to build on what has worked and make the indexes even more accurate at predicting progeny profitability.
Dr. Jon DeClerck covered the reasons for updating $API and $TI in more detail in his recent articles, including his article titled “Building on Progress: Why It’s Time to Update $API and $TI.” As he explained, “Updating $API and $TI is not about moving away from what has worked. It is about building on that success with better data, better technology, and a better ability to model the biology and economics of today’s cattle industry.
What is being updated?
1. Direct Incorporation of New EPD
It has been a busy and productive time on the IGS science team since I joined just one year ago. In the last year and a half, IGS has released five new predictions for members, including dry matter intake (DMI), $Gain, mature weight (MW), cow energy requirements (CER), and heifer pregnancy (HP). The release of these five new predictions reflects the hard work of not only the IGS science team, but also the Simmental breeders dedicated to reporting phenotypic data for these traits. It is something ASA members should be excited about and proud of. With the release of these new EPD came the opportunity to directly include carcass weight (CW), DMI, MW, and HP into the indexes. Previously, this information was approximated based on the relationships between these traits and others like growth. Think of it like estimating the weight of an animal based on its age and size. An experienced cattleman can often get surprisingly close. But actually putting that animal on a scale gives you a much more accurate measurement. In much the same way, using information from related traits allowed the previous indexes to make fairly good predictions of CW, DMI, MW, and HP. Now, integration of the new EPD into the indexes leads to a more direct, accurate measure of genetic potential for these traits.
2. In-House Simulation
Building an index requires more than knowing the EPD. IGS also has to determine what changes in those traits are worth economically. This is called an economic weighting. Establishing the economic weightings for each EPD is one of the more challenging aspects of developing an economic selection index. We can’t simply guess what the economic value of increasing marbling, or any other trait, by one unit would be. Instead, we use what’s called a simulation.
Think of this like the popular Farming Simulator video game where players manage and grow their own virtual farms. In a similar way, IGS created a simulation that models a cattle operation. We could think of it like our own “Cattle Ranch Simulator,” although no video game controllers were involved. The simulation plays out the index production scenario over a specified period of time and uses the results to generate the economic weightings needed for the index. The production scenario simulated for $API begins with a 500-head Angus cow herd where replacements are retained and all non-replacements are sold on a carcass basis. The simulation models a fixed land base. In other words, the “Cattle Ranch Simulator” operates on a fixed number of acres, which means the number of replacement females retained depends on the resources available from that land. The $API simulation plays out for 50 years.
The production scenario simulated for $TI also begins with a 500-head Angus cow herd, but no replacements are retained and all progeny are sold on a carcass basis. The $TI simulation plays out for two years, focusing on the short-term economic returns of terminal calves.
Another benefit of the updated indexes is that the simulation was developed in-house at IGS. This means economic parameters can be updated with greater frequency than they were previously, allowing the indexes to align with changes in the beef market going forward.
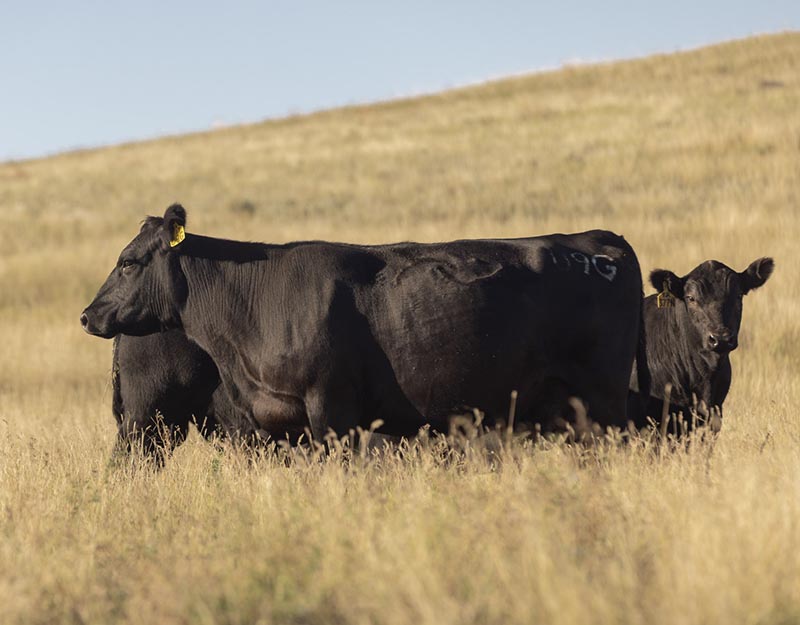
$API and $TI are valuable tools for selection and genetic progress.
3. More Precise Accounting of Heterosis
Another improvement to the indexes is the way they account for heterosis. ASA has long been an advocate for crossbreeding, promoting the performance gains from heterosis and breed complementarity The previous indexes accounted for heterosis in a more general way. Animals were categorized into broad breed groups, and then a heterosis adjustment factor was applied at the end. The updated indexes account for heterosis more precisely within the simulation itself. The simulation described above was repeated multiple times using bulls at different percentages of Simmental (or more specifically non-British or dairy), in 10% increments ranging from 0% Simmental to 100% Simmental. This results in a different set of marginal economic values and relative emphasis of traits (discussed below) for each 10% Simmental group. In other words, the relative emphasis of traits changes depending on the percentage of Simmental genetics being used. This allows the updated indexes to more accurately account for heterosis, breed advantages, and breed complementarity when Simmental bulls are bred to an Angusbased cow herd.
4. Updated Economics
The economics of the cattle industry have evolved, and they will continue to evolve over time. Economic selection indexes are designed to be robust, meaning they are intended to remain useful despite short-term fluctuations in the market. Because $API and $TI were being updated in other ways, this was also an opportunity to update the economic assumptions of the index.
Just like the Farming Simulator game has built-in economic assumptions, such as how much players are paid per bushel of corn, the “Cattle Ranch Simulator” also needs the underlying economic assumptions to generate the economic weightings discussed above under update #2. The economic inputs for the index simulation were based on historical CattleFax data and projected into the future using those pricing trends and relationships among inputs. The economic assumptions cover all the major aspects of cattle production from cow and backgrounding assumptions to feedyard economics and carcass premiums and discounts.
As a result of these updates, the amount of influence a trait has in the index, or the relative emphasis, has changed. You may be familiar with the $API pyramid, which showed the relative emphasis of traits for the previous $API. The relative emphasis of traits for the updated $API and $TI is shown in the pie charts. As described under update #3, the relative emphasis differs based on the incremental 10% Simmental groups; the 0%, 50%, and 100% Simmental groups are shown.
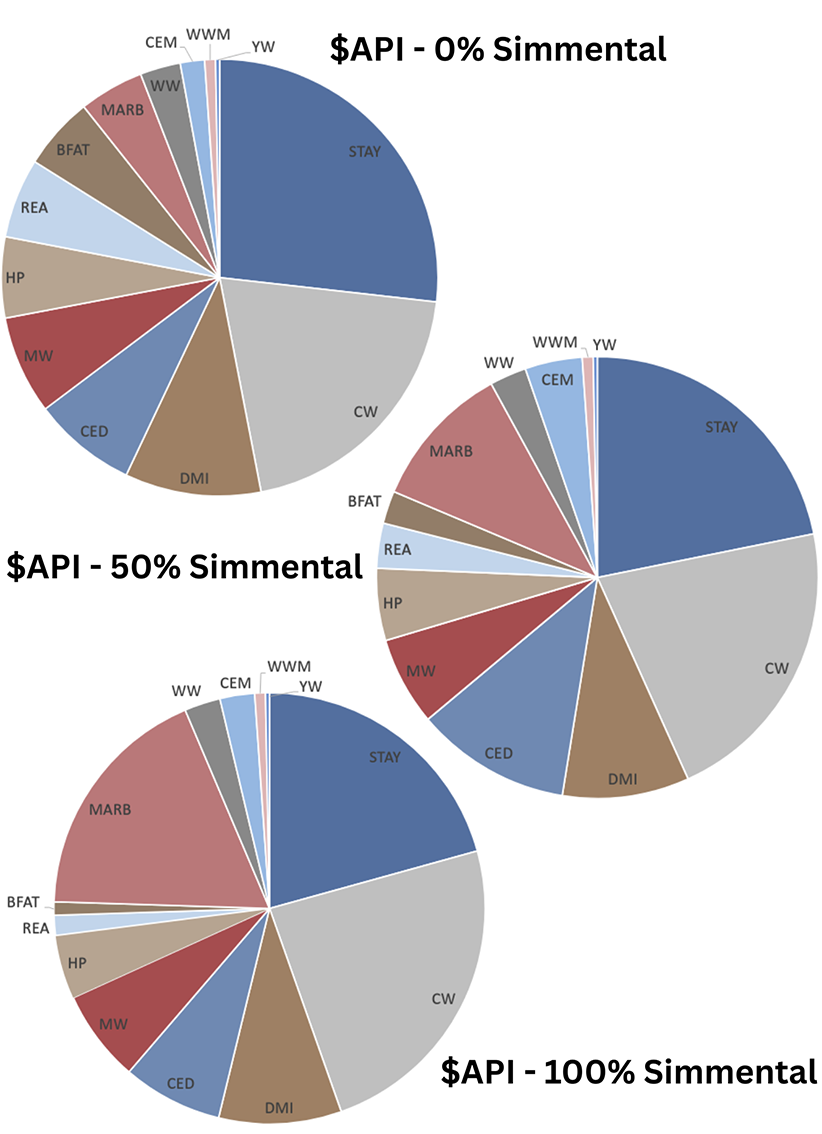
Figure 1. Relative emphasis, or the amount of influence a trait has in the index, pie charts for the All-Purpose Index ($API). STAY=Stayability; CW=carcass weight; MARB= marbling; DMI=dry matter intake; CED=calving ease direct; MW=mature weight; HP=heifer pregnancy; REA=ribeye area; BFAT= backfat; WW=weaning weight; CEM=calving ease maternal; WWM=weaning weight maternal; and YW=yearling weight.
Key Takeaways
| • $API and $TI are being updated to provide a more accurate prediction of progeny profitability using improved data, technology, and modeling. • New EPD are now directly incorporated into the indexes, giving the indexes more accurate information for CW, MW, HP, and DMI. • Heterosis is accounted for more precisely by modeling different levels of Simmental genetics rather than applying a broad adjustment factor. |
• Updated economic assumptions better reflect today’s cattle industry, accounting for factors across the cow-calf, backgrounding, feedlot, and packing sectors. • The updated indexes should be utilized just as the previous indexes were: use $API when retaining replacements and $TI when all offspring are marketed as terminal cattle. Use the updated percentile rankings when evaluating animals. |
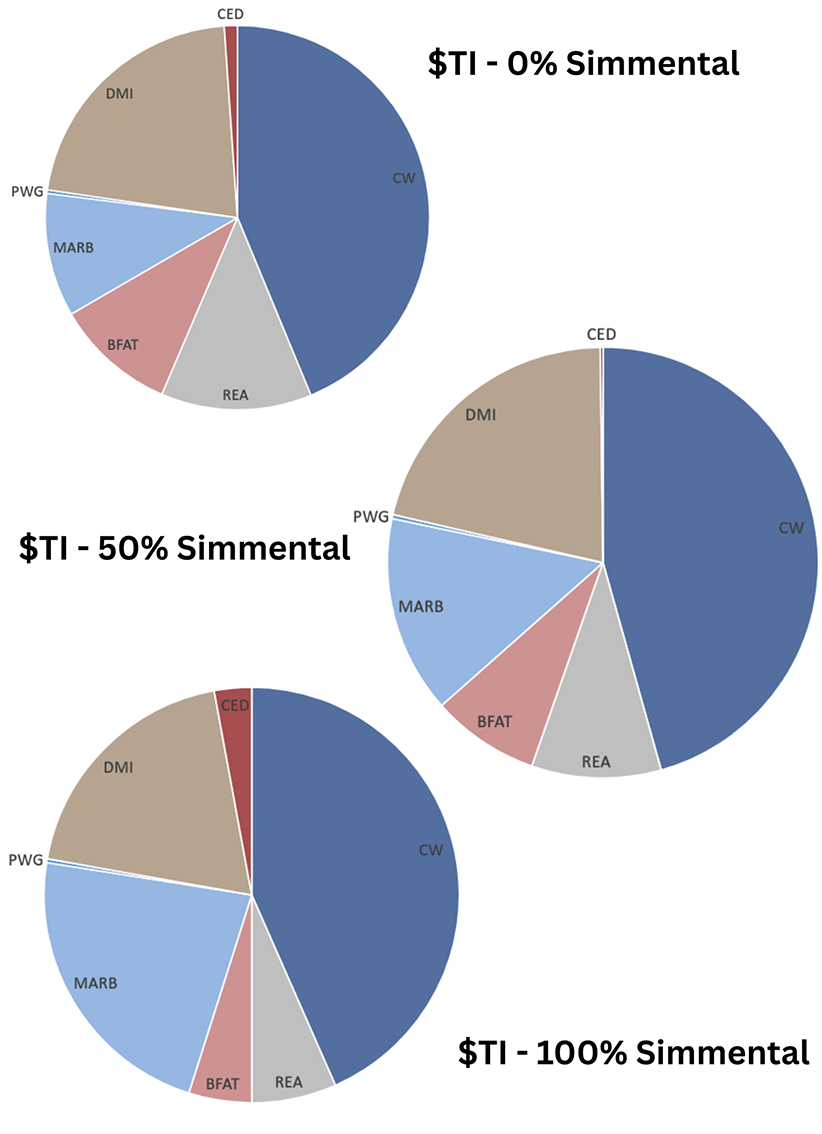
Figure 2. Relative emphasis, or the amount of influence a trait has in the index, pie charts for the Terminal Index ($TI). CW=carcass weight; MARB= marbling; DMI=dry matter intake; CED=calving ease direct; REA=ribeye area; BFAT= backfat; and PWG= post weaning gain.
How should I use the updated indexes?
The updated indexes can be used in selection and mating decisions just as the previous indexes were used. The same rule of thumb applies: If you are retaining replacements, use $API. If you are not retaining replacements, use $TI.
$API: Evaluates sires for use on the entire cow herd with a portion of their daughters retained and the remaining heifers and steers put on feed and sold on a grid.
$TI: Evaluates sires for use on the entire cow herd with all offspring put on feed and sold on a grid. Both $API and $TI are expressed in dollars per cow exposed and represent expected progeny profitability under the production scenario of each index. Indexes should be used as a comparison tool. When comparing two index values, a higher value indicates greater expected progeny profitability and is favorable. Indexes are designed to help simplify selection across multiple economically important traits. Individual EPD and other selection criteria can be used alongside the indexes to further refine selection based on your breeding objectives.
The table below outlines the average $API and $TI for the Simmental breed sub-groups for animals born after January 1, 2024, and provides context for interpreting the updated index values. Because of the updates, comparison of an animal’s previous index value and updated index value would not be meaningful. Instead, look at the animal’s updated percentile rankings to understand how it compares with other animals in the population.
| Simmental Sub-Group | Average $API | Average $TI |
| Purebred | 304 | 179 |
| Hybrid | 300 | 175 |
| Simbrah | 259 | 135 |
| Fullblood | 263 | 146 |
Table 1. Average $API and $TI for animals born after January 1, 2024, by Simmental breed sub-groups.
It’s also important to remember that there is not only one recipe for a high $API or $TI. There are different paths to profitability. Because an index combines multiple EPD, animals with different EPD profiles can still arrive at a similar $API or $TI. This allows producers to use the indexes to identify profitable animals while still having the flexibility to fit their individual operation.