Dr. Charley Martinez, University of Tennessee,
and University of Tennessee student collaborators: Mason Collins, Parker Wyatt, Eli Mundy, Dikshya Aryal, and Max Richardson
In August, I had the privilege of speaking at the Fall Focus Event. I spoke about the research we have done the last couple of years at the University of Tennessee regarding what information people use in bull buying. For simplicity of the studies, participants in our experiments looked at videos of bulls and their EPD profiles and estimated the market values of bulls.
We conducted experiments in West Virginia, Alabama, Iowa, and Tennessee. In the research, we also utilized eye-tracking technology to analyze what people look at when they are deciding/evaluating. A key takeaway from those studies was that people who utilized percentile ranks of EPD were more likely to be right in their decision-making. That spurred an experiment at this year’s Fall Focus.
At Fall Focus, my team and I conducted a study, utilizing the eye-tracking equipment, that analyzed decisionmaking by people who attended the event. Study participants, acting as consultants, were given four sets of bulls, and with each set, they were asked to select a bull that matched the buyer’s objective. The buyer in this scenario was a Simmental producer in southwest Missouri who manages 35 cows and retains ownership of all their calves through the feed yard annually. The stated objective also specified that the bull must rank in the top third of the breed. All the participants were given a picture of each bull and were instructed to judge them as sound. The participants were also given the bull’s All-Purpose Index ($API) and Terminal Index ($TI). In addition to these numbers, half of the participants (the treatment group) were randomly provided with the percentile ranks for both economic indexes (figure 1 displays the first set from the study with and without percentiles). The main emphasis of the buyer’s objective was to focus on terminal traits. We also asked questions regarding management and risk preferences.
Results
The complete study will be submitted for an academic journal, but this article covers some of the key takeaways. We had 101 participants in this study. Participants were from 25 different states, and we had one international participant. Additionally, 69% of participants indicated that they were seedstock producers, while 14% of participants indicated that they were commercial producers.
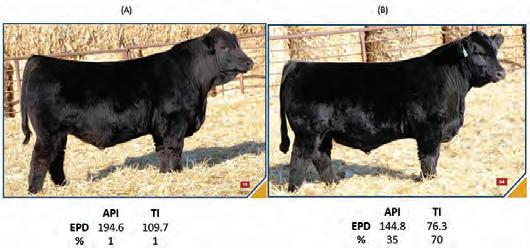
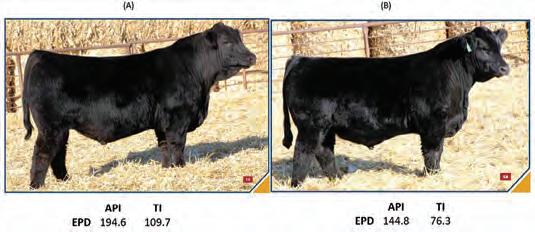
Figure 1: Example of the choice sets that participants would have seen in the study. Half of the participants were provided the percentile ranks for $API and $TI, as shown in the top set.
What do people use in evaluating bulls?
We asked all participants whether they use EPD, GE-EPD, physical characteristics, and/or EPD percentile ranks when evaluating bull values. The percentage of respondents who answered “yes” to each was 91%, 90%, 99%, and 95%, respectively. These responses represent their stated preferences. Using eye-tracking technology, we then examined whether these stated preferences aligned with actual behavior — specifically: (1) whether participants truly relied on these measures, and (2) which information they actually fixated on during the decision-making process.
Where do people fixate?
Using our eye-tracking technology, we put areas of interest (AOIs) in the system for each set. Figure two shows an example of the choice sets with AOIs. We categorized the AOIs to be phenotype (Pheno), the economic indexes ($API and $TI), and the percentiles for each.
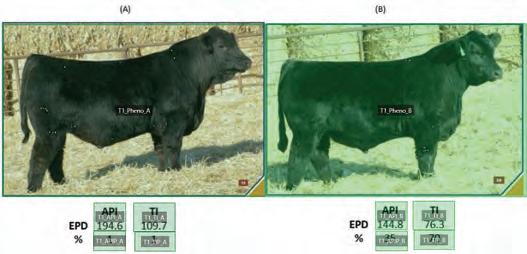
Figure 2: AOIs example of a choice set from the study.
With the AOIs, we can estimate the number of times participants fixated (spent more than three seconds) on an AOI. Table 1 displays the percentage that the participants fixated on each of the AOIs. The results from fixations provide revealed preference for their decisions.
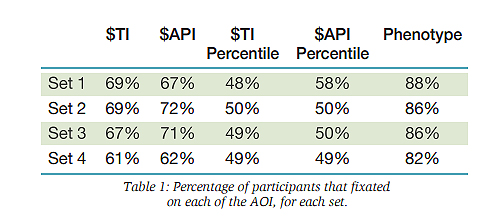
Table 1: Percentage of participants that fixated on each of the AOI, for each set.
Across the four decision sets, the percentage of observations associated with five information types ($TI, $API, $TI Percentile, $API Percentile, and Phenotype) have varying results. Phenotype consistently shows the highest percentages (ranging from 88% in Set 1 to 82% in Set 4), indicating it was the most prominent factor across sets. $TI and $API fall in the mid- to high 60s, with $API slightly exceeding $TI in Sets 2 and 3 (72% vs. 69% and 71% vs. 67%, respectively), while both drop in Set 4 (to 62% and 61%). Percentile measures are lower and more stable overall: $TI Percentile hovers around 49–50% in all sets, and $API Percentile is similarly steady at ~49–50% except for a higher value in Set 1 (58%). Overall, the pattern suggests relatively consistent use across sets,
with Phenotype most emphasized, modest variation in $TI and $API, and percentile ranks used less frequently and with minimal fluctuation.
The gap between stated and revealed preferences is most evident in how participants reported using percentile ranks versus how often they actually relied on them. Many respondents likely claimed to use percentile ranks because they were somewhat familiar with the concept, but the eye-tracking data shows that their real use was considerably lower. This difference may relate to one of the survey questions we asked: “For any given EPD percentile rank, which of the options below is higher within the breed: 1%, 99%, or I’m not sure?”
The correct answer is 1%. Among the 101 respondents, 86% answered correctly, 4% chose 99%, and 10% selected “I’m not sure.” This question helped verify whether producers could properly interpret percentile ranks when distinguishing high-value traits from low-value ones.
Together, the eye-tracking and survey findings highlight the importance of understanding how percentile ranks can enhance decision-making. Percentile ranks add clarity to EPD by showing how an animal compares to the broader population; without this understanding, producers may misinterpret genetic merit and lose the advantages this information is meant to offer. Notably in this study, participants who used EPD percentile ranks were 13.3% more likely to make correct decisions.
A key takeaway from this study is that using more complete and well-understood information improves decision quality. The bull decision inherently induces risk. Risk mitigation can be achieved with useful information. The discrepancy between stated and revealed preferences underscores the need for continued education — not only on EPD percentile selection itself, but also on how to effectively apply these genetic selection tools during the decision-making process. .