by Dr. Elizabeth Dressler, ASA Lead Geneticist
The release of mature weight (MW) and cow energy requirements (CER) EPD
provides breeders with powerful new tools to better manage cow size, efficiency, and long-term profitability. While selection for increased growth has driven progress in weaning and yearling weights, it has also contributed to rising mature cow weights over time. These new EPD allow producers to maintain performance where it pays, while intentionally aligning mature size and feed requirements with their environment and resources. Used together, MW and CER EPD offer a more complete picture of cow productivity and efficiency, helping breeders make balanced, economically informed selection decisions that support progress across the cattle industry.
Mature Weight EPD
The MW EPD is reported as the difference in pounds of cow body weight at six years of age and a body condition score (BCS) of 5. A higher MW EPD indicates a genetic tendency for heavier daughters at maturity, while a lower MW EPD indicates a genetic tendency for lighter daughters at maturity.
How to use the MW EPD
The MW EPD is used to compare the predicted differences in mature weights of daughters. For example:
Bull A = 150 MW EPD
Bull B = 100 MW EPD
You would expect daughters from Bull B to weigh 50 pounds less, on average, at age six and BCS 5 compared to daughters from Bull A.
Why is MW important?
Mature cow weight has a direct economic impact on cow salvage value. The MW EPD is also factored into the calculation of the cow energy requirement (CER) EPD, allowing breeders to assess annual feed costs and energetic efficiency.
Previously, ASA had a MW EPD that was based on correlated weight traits. This was not released on individual animals, but was incorporated in the all-purpose index ($API). Now, the MW EPD utilizes MW phenotypes in addition to the correlated traits for an improved prediction published on all animals. $API will eventually be updated to incorporate this improved MW EPD.
How to collect mature cow weight phenotypes
Mature cow weights can be collected at any age after yearling. Entire cow groups should be weighed on the
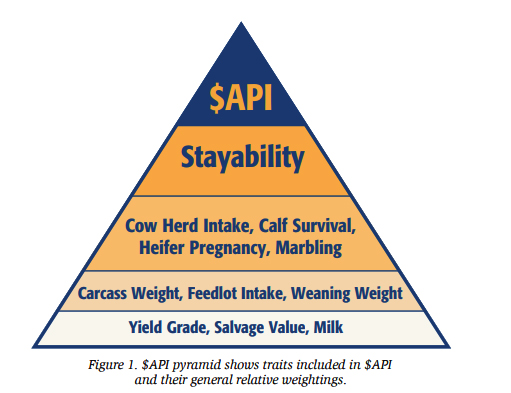
Figure 1. $API pyramid shows traits included in $API and their general relative weightings.
same day and within 45 days of weaning their calf. Members are highly encouraged to take a BCS at the same time as mature weight collection. Entire cow groups should be scored on the same day, and by the same person, for proper contemporary grouping.
Members can submit weights and BCS for cows of any age between two and 12 years. Records on the same cow across multiple years are also accepted. Members are encouraged to submit mature cow weight and BCS records on their cow herds. Submitting these phenotypes will increase the accuracy of the MW EPD within your herd while expanding the genetic evaluation dataset. The average MW EPD accuracy of genotyped animals is currently 0.43.
How is the MW EPD related to other earlier-in-life growth EPD?
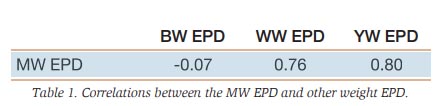
The MW EPD does not have a strong relationship with the BW EPD. In contrast, the MW EPD has a strong, positive correlation with both the WW EPD and YW EPD. This means that animals with higher WW and YW EPD also tend to have higher MW EPD. This correlation is strong, meaning this relationship holds true in most cases. However, because the correlations between these traits are less than one, it is possible to select and breed for animals that maintain growth performance while moderating mature cow weight. In other words, growth and mature size are related, but they can be managed independently with selection.
Figure 2 below shows the relationship between the YW EPD and the MW EPD for animals born between 2020 and 2025. This graph further shows that animals with higher YW EPD also generally have a higher MW EPD. Dotted red lines are drawn on the graph at both the YW and MW medians, creating 4 quadrants.
Animals in quadrant 2 have larger YW EPD and larger MW EPD, while animals in quadrant 3 have smaller YW EPD and smaller MW EPD. This follows the general relationship discussed above. Animals in quadrant 1 have lighter YW EPD, but larger MW EPD, which would typically be undesirable. Quadrant 4 animals have heavier YW EPD, but lighter MW EPD, which is typically seen as desirable. Animals in quadrant 4 would be those to select to maintain growth performance and moderate mature cow weight.
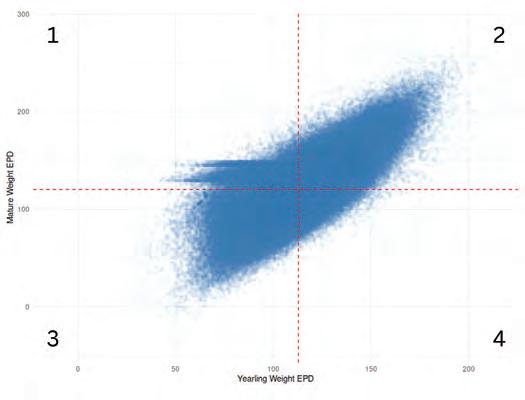
Figure 2. Scatterplot of the relationship between yearling weight EPD and mature weight EPD for animals born in the last five years (2020–2025).
How has mature cow weight changed over time?
Cattle producers have put a large emphasis on selection for heavier weaning and yearling weights, which has led to substantial gains in those traits. Due to the strong relationship between these earlier in life weight traits and mature weight, this selection pressure has also led to increases in mature weight. The genetic trend of the MW EPD in the Simmental breed is shown in Figure 3. Despite having different average MW EPD in 2025 ranging from about 110 to 130, all four of the Simmental breed sub-groups (purebred, hybrid, Simbrah, and fullblood) have experienced an upward trend in MW EPD over the last 20 years.
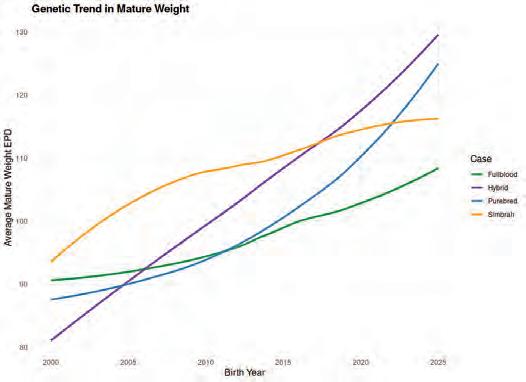
Figure 3. Genetic trend graph for mature weight EPD by Simmental breed sub-group.
How should MW EPD percentile rankings be interpreted?
The MW EPD is included in the percentile ranking tables found on Herdbook.org. Go to “Data Search,” “% and EPD Avrgs,” and choose “Purebred.”
Heavier MW EPD are assigned percentile ranks closer to 1%, while lighter MW EPD are assigned percentile ranks closer to 95%. This direction reflects the direct economic relationship between mature cow weight and salvage value, as heavier cows typically return a higher salvage value. However, the direction of the MW EPD percentile tables should not be interpreted as a higher MW EPD being “better.” Optimal mature cow size depends on a producer’s environment, feed resources, and management system. Selection decisions should focus on identifying the mature weight that best fits an individual operation, which may not be at either extreme of the population (1% or 95%).
For these reasons, the CER EPD was developed alongside the MW EPD. The CER EPD describes differences in cow energy requirements and provides a tool to evaluate expected annual feed requirements and feed costs. Used together, the MW and CER EPD allow breeders to balance mature cow size with energetic efficiency when making selection decisions.
Cow Energy Requirements EPD
The CER EPD is reported as the yearly difference in pounds of total digestible nutrients (TDN) required for a cow aged six years. A lower CER EPD indicates a genetic tendency for daughters that require less energy to support production, while a higher CER EPD indicates a genetic tendency for daughters that have higher energy demands.
How to use the CER EPD
The CER EPD is used to compare the predicted differences in annual TDN requirements of daughters. TDN stands for total digestible nutrients. This is a beef cattle nutrition term that refers to the amount of usable nutrients in a feedstuff, and is a practical measure of dietary energy. For example:
Bull A= 100 CER EPD
Bull B= 50 CER EPD
You would expect daughters from Bull B to require 50 pounds of TDN less per year at age six, on average, compared to daughters from Bull A.
What information is used to calculate the CER EPD?
A cow’s primary energy needs are maintenance, gestation, and lactation.
• Maintenance: the energy needed for the cow to maintain her body condition.
• Gestation: the energy required to carry a pregnancy.
• Lactation: the energy needed to produce milk for her calf.
EPD that correspond to each of these energy requirements are available at ASA:
• MW EPD representing maintenance.
• Birth weight (BW) EPD representing gestation.
• Milk EPD representing lactation.
These three EPD are combined in prediction equations to estimate a cow’s energy requirements. The prediction equations are based on extensive research in the nutrition field, specifically published by the National Research Council (NRC) in the Nutrient Requirements of Beef Cattle, which is a long-standing guiding reference in the nutrition field.
Because the BW, Milk, and MW EPD contribute to the CER EPD, submitting phenotypic data that influence these three EPD is encouraged, including birth weight, weaning weight, and mature weight phenotypes.
Why is the accuracy of the CER EPD generally lower than other EPD?
The average accuracy of the CER EPD for genotyped animals is currently 0.22. The accuracy is generally lower because the CER EPD is derived from prediction equations rather than a directly measured phenotype. Directly measured phenotypes provide a stronger source of information for estimating genetic differences compared to prediction equations, which rely on indirect information.
How should CER EPD percentile rankings be interpreted?
The CER EPD is included in the percentile ranking tables found on Herdbook.org. Go to “Data Search,” “% and EPD Avrgs,” and choose “Purebred.”
Lower CER EPD are assigned percentile ranks closer to 1%, representing lower expected annual energy needs, while greater CER EPD are assigned percentile ranks closer to 95%, representing greater energy requirements. The CER EPD provides breeders with a tool to manage feed resources and evaluate the energetic efficiency of their cow herd. .