What are Your Customers Really Thinking?
by Lilly Platts
Seedstock producers work consistently to make sure catalogs present the most pertinent information to commercial customers.
With the ever-expanding suite of EPD, deciding what to put in a catalog can be challenging, especially considering the fast-paced nature of many bull sales. Dr. Charley Martinez studies bull-buying behavior through the use of eye-tracking software. He presented his work and findings during Fall Focus 2025 in Columbia, Missouri.
Dr. Charley Martinez and his team first started working on this research in 2021. Martinez ran his idea by Dr. Troy Rowan to formulate experiments in Alabama and Tennessee, which evaluated whether or not producers were using EPD to make sale selections, and tested the ability to predict value. “We were just trying to elicit their belief about what a bull is worth,” Martinez shared.
Next, Martinez purchased statBull Buying Behavior Part 1e-of-the-art eye-tracking equipment, which uses movement and heat tracking technology to reveal where a person’s eye goes first, how long their attention is focused on a single thing, and other behaviors. Martinez and his team published their first study, which posed the question, “do EPD matter?” After finding that the answer was yes, their next question was, “what EPD matter?”
EPD systems have developed drastically since their introduction. The earliest EPD were for the basics: birth weight, weaning weight, yearling weight, and milk, for example. In the early 2000s, percentile rankings became a part of the system. During this same time, researchers started developing economic selection indexes, which provide a single monetary measure. Over time, more EPD and selection indexes have been added.
Economic selection indexes are typically placed at the far right-hand side of the overall EPD profile. Martinez shared that this decision may have had an unintended effect on behavior. “Visual cognition literature supports the idea of ‘what comes first is seen first,’ which is known as the primacy effect,” Martinez shared.
Under this assumption, the first EPD that producers see are not the indexes, which have been developed to simplify decisions, and have been proven to improve selection decisions. Instead, they are likely taking in those foundational EPD like Milk, and potentially missing the indexes entirely. Recent eye-tracking studies suggest that people often skip information on the far-right, especially when the information is dense or busy. “If we can’t get people to look at or understand them [indexes], then how are they supposed to use them?” Martinez said.
The objectives of Martinez’s latest study were: 1.) To understand the influence of different EPD profile layouts on buyers’ accuracy of seedstock bull price prediction; 2.) To understand producers’ characteristics that affect accurate decision-making when buying a bull; 3.) To understand producers’ accurate decision-making across different states and breeds; and 4.) To understand the factors that affect accurate prediction of qualitydifferentiated bulls by producers.
The team collected data through “lab in the field” experiments, using the eye-tracking computers and software. Participants were paid a small amount to participate, with an extra incentive for answering all of the questions correctly. Across several states, 208 participants looked at 18 bulls, with the challenge of predicting value. These bulls had been sold, which gave the researchers a baseline for the actual real-world value of the animals.
The participants looked at a looping video of each bull, as well as an EPD profile. There were three treatment groups and a control. The bulls were Angus, Simmental, and Hereford, and were chosen to represent high, average, and low EPD profiles. The “control” group saw what is typically presented in a bull sale catalog. The treatment groups either saw the EPD in the typical order with percentile ranks, the EPD in the typical order without percentile ranks, the EPD in the reverse order with percentile ranks, or the EPD in reverse order without percentile ranks.
The participants were given minimum and maximum values to keep their estimation within, and challenged with predicting the value of the bulls. The participants were also surveyed on things like their involvement in the beef industry, the breeds used in their own operation, age, income, comfort with risk, and other general measures. The survey also asked if the participants used EPD in real life, or genomically enhanced (GE) EPD. Just over 80% said they use EPD, and around 50% said they use GE-EPD. Around 90% said they use phenotype in making selections.
Opposite: Economic selection indexes can help producers simplify their selection decisions on sale day. Where these figures are placed in a sale catalog is important. Photo by Susan Russell.
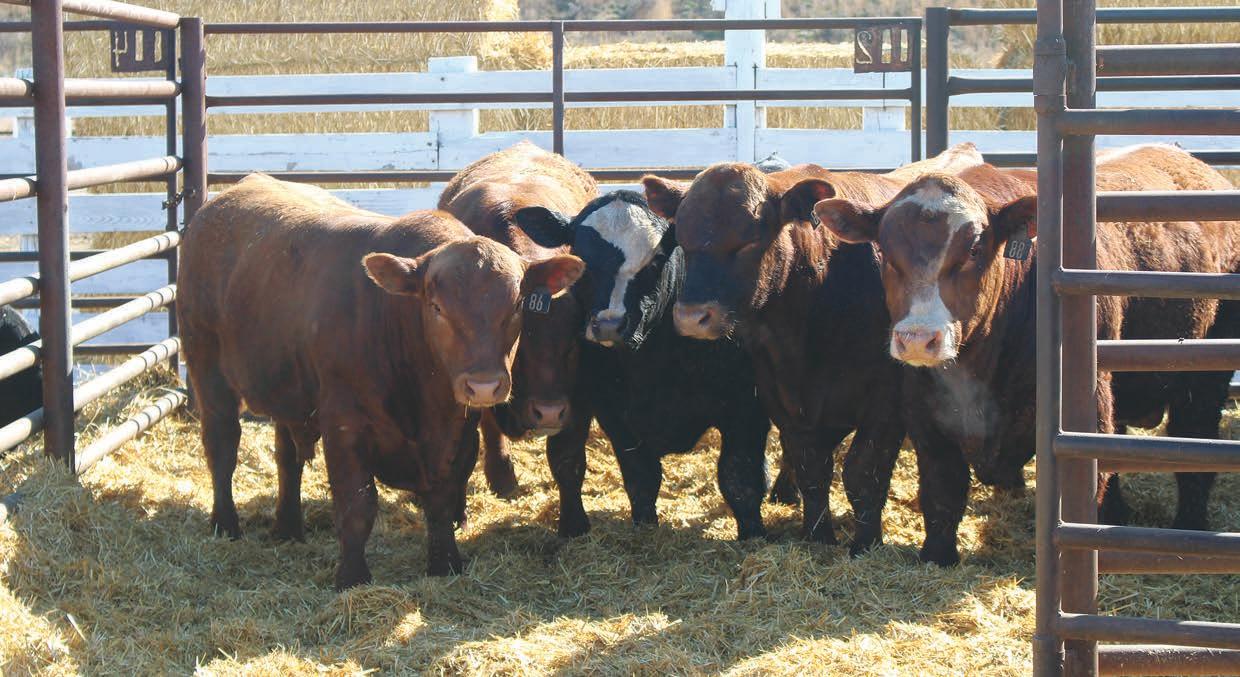
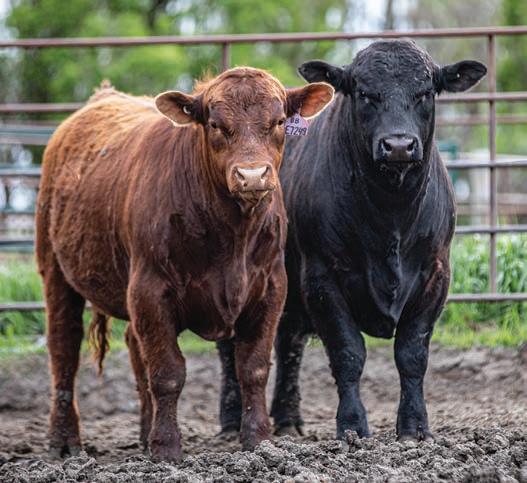
Above: Data shows that phenotypic appraisal is a top priority for most producers. Photo by Liv Stavick.
significant amount of information is available for registered cattle, which can easily lead to information overload. Photo by the Grant Company.
This study showed that participants were most successful at predicting value when the EPD were presented in an “inverted” or opposite order, and when percentile ranks were displayed, with the index measures on the left. The study also showed that participants who said they utilize GE-EPD were better at predicting the price of the bulls. People who reported being more risk-seeking were also more likely to be wrong on the bull predictions. The study also measured a person’s relationship to delayed gratification. The participants who reported being more ok with delayed gratification were more likely to accurately predict the value of the bulls. “The folks who are thinking of and tolerant of setting aside something to have a bigger gain at the end are better off,” Martinez said.
The eye tracking technology used in the study creates a heatmap based on the amount of time a person spends looking at one area. For example, if someone looked at the CE EPD for five seconds, and the bull’s head for one second, the CE EPD area would be a more red color, while the bull’s head would be green. These “areas of interest” reveal what people are actually looking at and considering when evaluating animals and EPD profiles. The aggregate map of this data shows the percentage of time that people spend “fixated” on an area (spending more time), or simply “gazing” (a passing glance).
This data shows that people overwhelmingly spend more time looking at an animal’s phenotype, versus EPD and indexes. Only 11% gazed at the indexes, with 10% fixating. The opposite was true for phenotype, with over 97% gazing, and 100% fixating. Martinez shared that this data shows that more education is needed on indexes, as well as how to differentiate the measures across breeds.
The results of this study also bring up the important question of how producers should be laying out their bull sale catalogs. With the number of EPD and data points available today, choosing what to include is a challenge, and it’s easy to create information overload. This is especially true for producers who cater to the commercial industry. “Information overload has been proven to cause confusion, and uncertainty in decisionmaking,” Martinez said.
If less is better, the challenge becomes choosing which measures matter the most. EPD ranks and percentiles, as well as having the economic indexes appear on the left, improved the ability to accurately predict bull value, and Martinez suggests that producers should consider better placement of these numbers. “Our study suggests that emphasizing economic selection indexes in catalogs can enhance producers’ evaluation accuracy by better helping them connect merit with economic value,” Martinez shared.
Martinez and his team set up a similar study for Fall Focus participants. The results of that study will be shared in Part 2 of this article. .
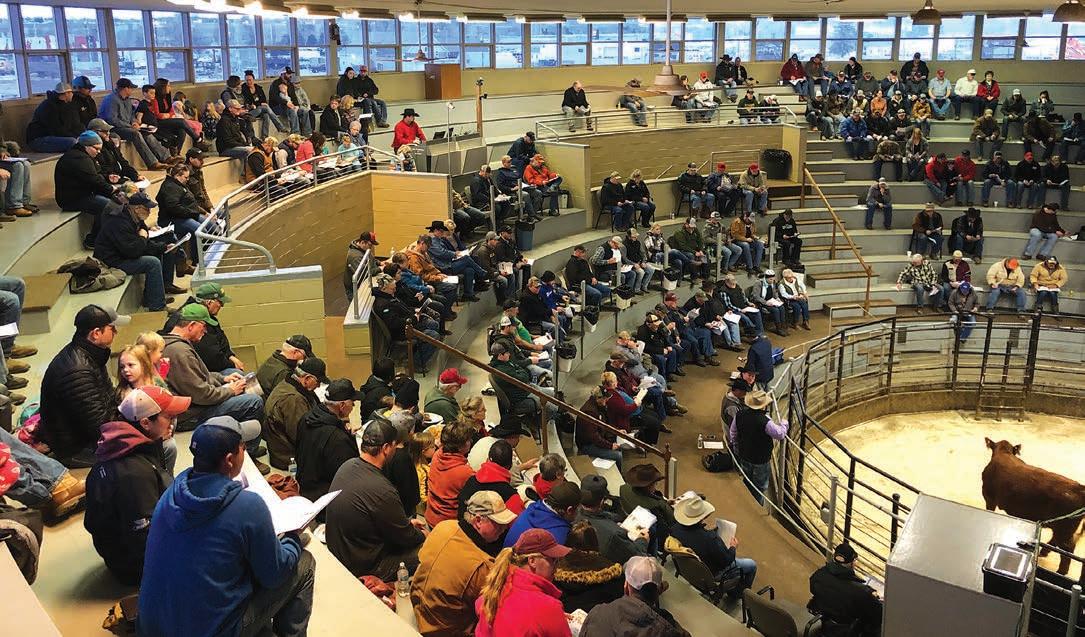
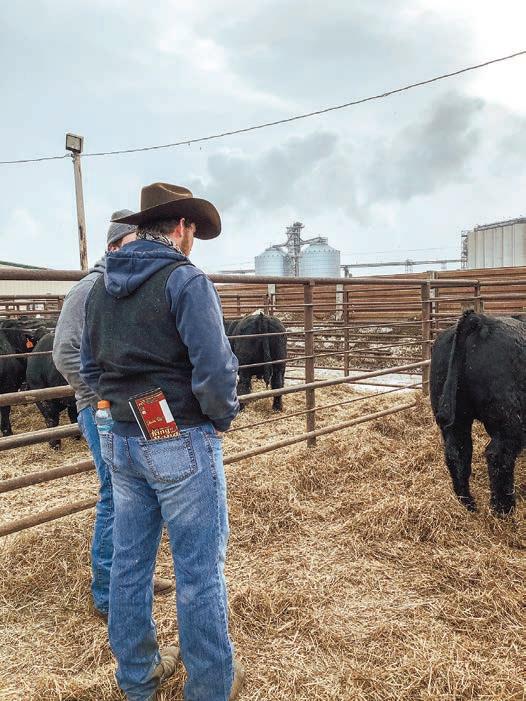
Ensuring that customers have the most important information in front of them on sale day is a priority for seedstock producers. Photo by Kelly Finke.